How Zalando manages 140+ Kubernetes Clusters
Posted: | More posts about kubernetes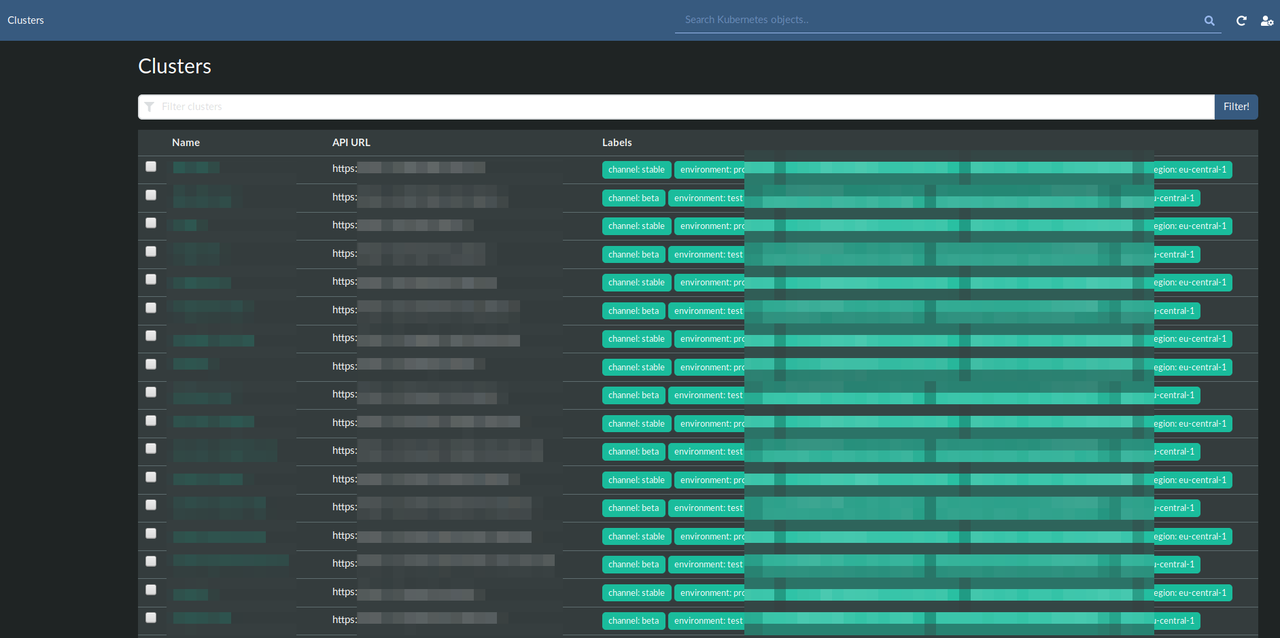
Recently I was asked "how do you manage that many Kubernetes clusters?". This post tries to provide some insights on how we manage 140+ Kubernetes clusters on AWS at Zalando.
I already wrote a blog post about why you might want many clusters and Mikkel gave a great talk at KubeCon EU 2018 on how we continuously deliver our Kubernetes infrastructure (check it out on YouTube!). This blog post is merely a recap and aggregation of existing information.
Context
Zalando has 200+ development teams which are fully responsible for owning their applications including 24/7 on-call support ("you build it, you run it"). Our Kubernetes platform team provides "Kubernetes as a Service" to 1000+ Zalando developers with the following goals in mind:
No manual operations: all cluster updates and operations need to be fully automated.
No pet clusters: clusters should all look the same and not require any specific configurations/tweaking
Reliability: the infrastructure should be rock-solid for our delivery teams to entrust our clusters with their most critical applications
Autoscaling: clusters should automatically adapt to deployed workloads and hourly scaling events are expected
Architecture
We provision clusters always in pairs, i.e. one production and one non-prod cluster per domain / "product community".
Each cluster lives in a completely new and isolated AWS account. The basic AWS account infrastructure (VPC, routes, ..) is configured via a custom Python tool (Seven Seconds) and looks the same for Kubernetes and non-Kubernetes accounts (our soon to be EOL "STUPS" infrastructure).
Our whole production cluster configuration is located on GitHub. The cluster is created via CloudFormation (CF) templates. There are at least four CF stacks per cluster:
the etcd cluster (which lives outside the master nodes), etcd-cluster.yaml
the main cluster stack (security groups, master LB, etc), cluster.yaml
the master node pool, master stack.yaml
the default worker node pool, worker stack.yaml
There can be multiple worker node pools, e.g. with GPU-nodes, EC2 Spot instances, etc.
Note that we don't use any Terraform (we never did).
Both master and worker nodes run our self-baked AMI. The AMI is based on Ubuntu and contains all necessary Docker images for Kubernetes. We used CoreOS ContainerLinux before, but decided to switch to a more mainstream distribution with a more promising future. The pre-baked AMI also allowed us to improve node boot time (i.e. faster scale out for clusters).
Configuration
All clusters, as well as AWS accounts, are registered in a central Cluster Registry. The Cluster Registry is a proprietary REST API backed by PostgreSQL. You can find its OpenAPI specification on GitHub. Each cluster has a number of attributes:
the immutable cluster ID, e.g. "aws:123123123123:us-east-1:kube-9"
the cluster alias (cluster name), e.g. "foobarlab"
the AWS account it's running in (account ID and region)
the environment (production or "test")
the configuration channel (stable, beta, alpha, or dev)
lifecycle status (whether the cluster is currently provisioned, allocated, or decommissioned)
key/value config items for cluster-specific configuration options such as external API keys
configured node pools (e.g. EC2 instance type) and key/value config items per node pool
Our tooling (custom CLI, kube-resource-report, kube-web-view) can query the Cluster Registry REST API to list all clusters, e.g. our zkubectl command line tool can list clusters:
zkubectl list
Id                                           │Alias                           │Environment│Channel│Version
aws:123740508747:eu-central-1:kube-1          foobarlab                        production  stable  5f4316c
aws:456818767898:eu-central-1:kube-1          foobarlab-test                   test        beta    9f1b369
aws:789484029646:eu-central-1:kube-1          abckub                           production  stable  5f4316c
aws:012345670034:eu-central-1:kube-1          abckub-test                      test        beta    9f1b369
...
You can see two cluster pairs ("foobarlab" and "abckub") where the production clusters use the "stable" channel and non-prod clusters use the "beta" configuration channel. The "Version" column shows the git sha of the currently applied cluster configuration.
A similar cluster list rendered by Kubernetes Web View:

See also my blog post on Kubernetes Web UIs and their missing support for multi-cluster use cases.
Updating
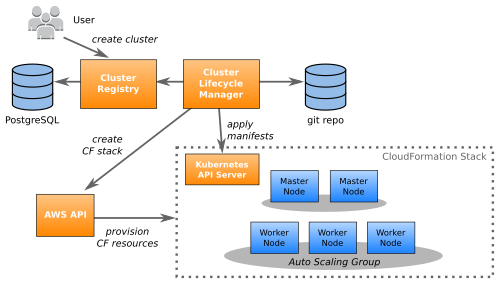
The Cluster Lifecycle Manager (CLM) continuously monitors both Cluster Registry and our central git repo for changes. Changes are applied by the CLM:
CloudFormation stacks are updated
rolling node updates are performed as necessary (e.g. when our AMI changes)
Kubernetes manifests are applied (mostly DaemonSets and Deployments in
kube-system)
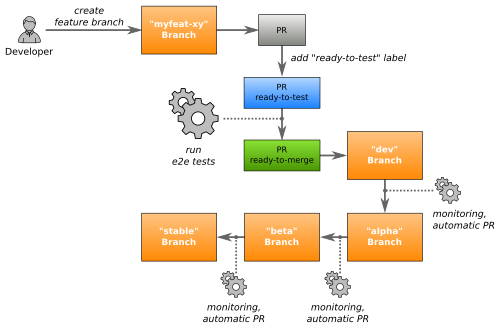
Changes (e.g. a version update of some system component) are initiated by opening a Pull Request to the "dev" branch (channel). Every change PR is automatically tested end-to-end (e2e) and only merged after passing tests and human approval. The e2e tests run official Kubernetes conformance tests and Zalando-specific tests against a newly bootstrapped cluster. E2E tests coverage includes:
testing cluster creation and update (e2e tests create a new cluster with the previous version and update to the PR changes)
testing core Kubernetes functionality: Deployments, StatefulSets, etc
testing Zalando admission controller logic
testing audit logs
testing Ingress, External DNS, AWS ALB, and Skipper
testing PSP (PodSecurityPolicy)
testing autoscaling on custom metrics
testing AWS IAM integration
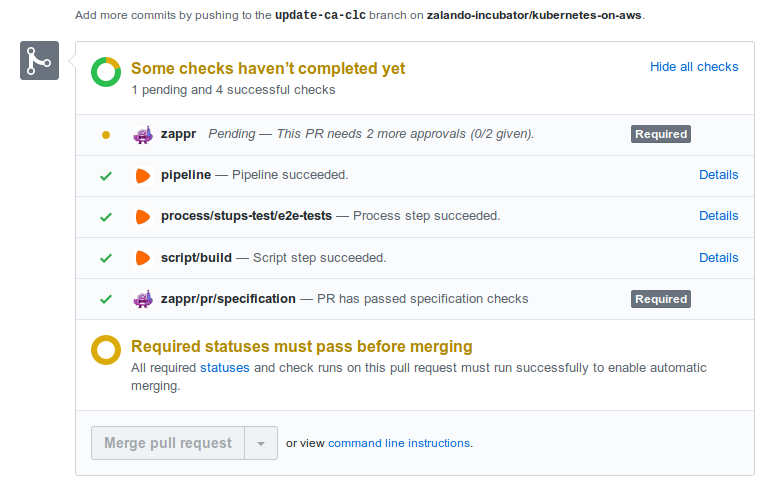
Each e2e test run currently takes 35-59 minutes to complete. Here some example PR where the e2e tests completed successfully and only the human approval ("+1") is missing to merge:
Each change moves through the different channels (git branches) until it reaches all production clusters ("stable" channel).
During both rolling update of cluster nodes and automatic scaling of the clusters, our infrastructure must reschedule application Pods away from nodes that are being decommissioned. Applications can use Pod Disruption Budgets (PDBs) to declare how disrupted they can be during an update. We defined the following SLAs for operations like cluster updates:
SLA |
Production clusters |
Test clusters |
|---|---|---|
Minimum lifetime of a Pod before it's force terminated during updates |
3 days |
8 hours |
Minimum amount of time after a node is selected for termination before the infrastructure starts force terminating Pods |
6 hours |
2 hours |
Interval between force terminations of Pods on the same node |
5 minutes |
5 minutes |
Minimum lifetime of ready Pods in the same PDB as the one considered for force termination |
1 hour |
1 hour |
Minimum lifetime of non-ready Pods in the same PDB as the one considered for force termination |
6 hours |
1 hour |
Application Pods are therefore forcefully terminated after three days, even if they defined a Pod Disruption Budget to prevent it. This behavior allows us to continuously update our clusters even if some applications are misconfigured.
Note that our users (development teams) can stop and block cluster updates anytime (e.g. if they detect a problem).
See also Mikkel's great KubeCon talk about our approach to cluster updates.
Avoiding Configuration Drift
All clusters look mostly the same, there are only a few configuration options which differ between clusters:
secrets, e.g. credentials for external logging provider
node pools and their instance sizes
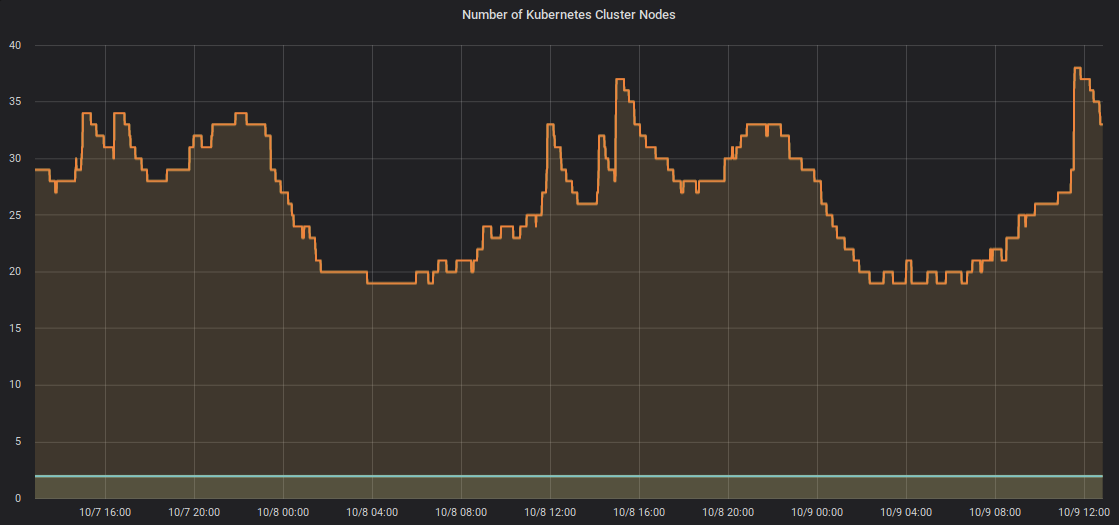
The Cluster Autoscaler scales cluster node pools depending on resource demand thus not requiring manual configuration of pool sizes. Here a chart of one cluster autoscaling up and down over two days:
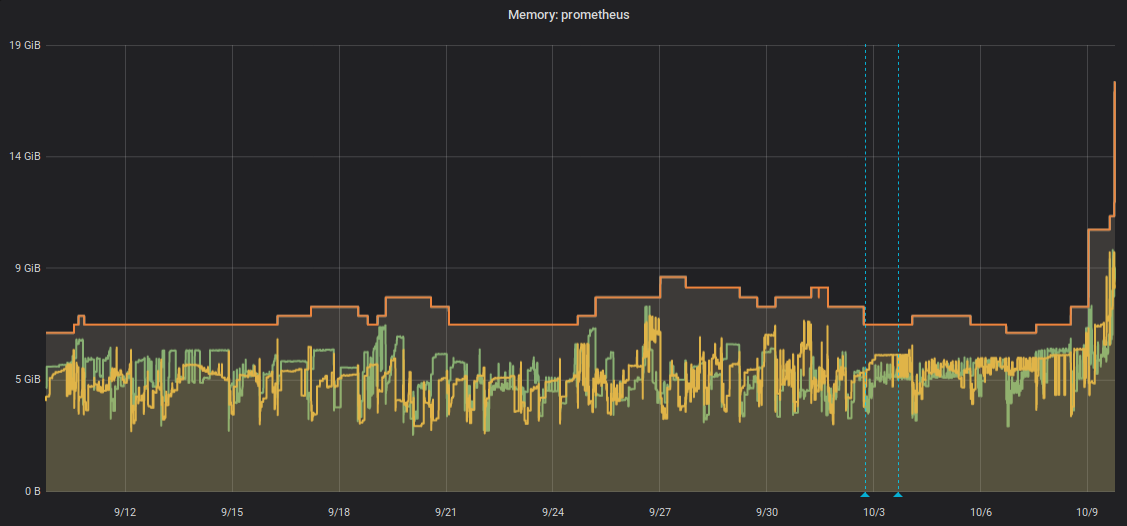
Some components need vertical scaling based on cluster size. We use the Vertical Pod Autoscaler (VPA) to avoid tuning these settings by hand. These system components use VPA at the moment:
Prometheus
Heapster / Metrics Server
Our smallest Prometheus instance uses just 512 MiB, others scale up to 9 GiB, like this graph shows:
Monitoring
Our main monitoring system is ZMON. ZMON has a concept of "entities": a ZMON entity can represent anything you want to monitor, e.g. servers, pods, or even teams.
Provisioning a new cluster will automatically register new entities (e.g. for the new AWS account, for the nodes, deployments, pods, etc). This allows having some generic checks and alerts which automatically become active for these new entities.
ZMON provides metrics, alerting (+ paging to OpsGenie), and Grafana dashboards.
Our Kubernetes team does not get alerted on restarting user pods or similar. Delivery teams are responsible for their applications end-to-end.
Additional observability across clusters is gained via OpenTracing instrumentation (LightStep), central application logging (Scalyr), kube-resource-report, and kube-web-view.
Vanilla Kubernetes
How much does our setup diverge from a "vanilla" Kubernetes (from a user perspective)? The answer is: "not much":
Kubernetes API authentication uses Zalando OAuth tokens
CPU throttling is disabled via kubelet flag [1]
we force memory requests == limits to prevent memory overcommit
Ingress uses External DNS, our ALB Ingress Controller, and Skipper --- Ingress annotations are optional, but Skipper has some useful features
PlatformCredentialsSetis a proprietery CRD to integrate with our OAuth infrastructureStackSet is our approach to do traffic switching and gradual deployments
kube-downscaler downscales test deployments after work hours
our DNS setup differs slightly: we use the
ndots: 2setting (instead ofndots: 5which is the default) [2]
Non-production clusters provide roughly the same features as plain GKE or Digital Ocean clusters. Production clusters come with some contraints:
no write access to Kubernetes API (only via CI/CD)
compliance webhooks enforce certain labels and production-ready Docker images [3]
Summary
Our approach served us well in the past years and allowed us to scale without increasing our team size:
we could seamlessly update our oldest cluster from Kubernetes 1.4 (released September 2016) to 1.14 without downtime [4]
we can keep up with the quarterly Kubernetes releases, i.e. we do one major upgrade at least every quarter
the frequent cluster updates train everyone that small disruptions are normal (and Pods are currently max. 20 days old)
we try to avoid pet clusters: clusters look mostly the same and cluster autoscaling and VPA help us avoid manual tweaking
our automated cluster e2e tests saved us more than once (e.g. recent 1.14.7 AWS ELB issue)
For more information, see our repo with public Zalando presentations and find some members of our Kubernetes team also on Twitter:
Also feel free to mention @ZalandoTech and ping me on Twitter.
UPDATE 2019-12-17
The recorded video of my AWS re:Invent talk on how Zalando runs Kubernetes clusters at scale on AWS is online. The talk's content is very similar to this blog post.