One month of Kubernetes VPA
Posted: | More posts about kubernetes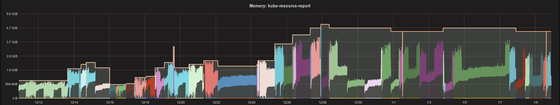
This is a small report of what I observed after one month of using the Kubernetes Vertical Pod Autoscaler (VPA) for a simple application (only a single pod).
The Kubernetes Resource Report (kube-resource-report) is a rather simple Python script to generate a static HTML report of Kubernetes resource requests, usage, and slack costs. It collects all nodes, pods, and metrics (CPU/memory usage) and renders a bunch of Jinja2 templates.
I deployed kube-resource-report together with a nginx container (to serve the generated HTML) as a single pod in our Zalando environment. By nature of the script, it scales purely vertically: more clusters, nodes, and pods will lead to an increase in the size of the in-memory data structure. Initially I deployed kube-resource-report with static CPU and memory requests and had to tweak them multiple times. The third time I was fed up and decided to try out the recently deployed VPA infrastructure. Switching to VPA was very easy: I just had to add the proper CRD for it:
apiVersion: autoscaling.k8s.io/v1beta1
kind: VerticalPodAutoscaler
metadata:
  name: kube-resource-report
spec:
  selector:
    matchLabels:
      application: kube-resource-report
  updatePolicy:
    updateMode: Auto
That was very easy for me (as the VPA infrastructure was already set up by our Zalando Kubernetes team) and it immediately worked!
But how does it look like after 30 days of running with VPA? Here the CPU and memory graphs (click on the image to see original size):
CPU
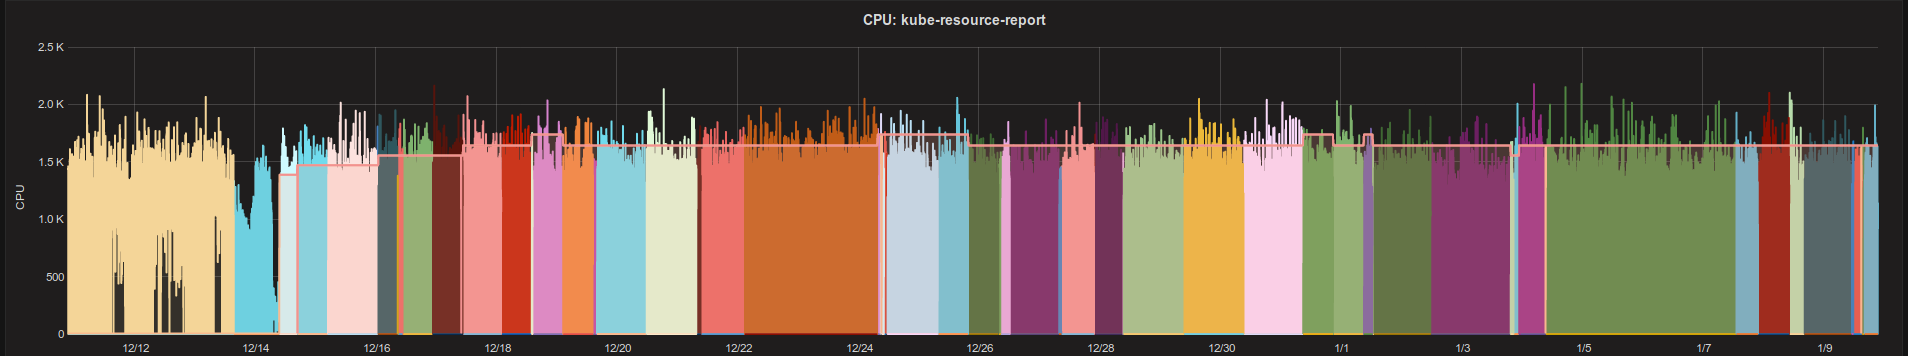
As you can see, I specifically set low CPU requests before switching to VPA as I decided that the (background) container generating the HTML can have low CPU priority (we disabled CPU CFS quotas in all our Zalando clusters, so no CPU throttling is happening).
Memory
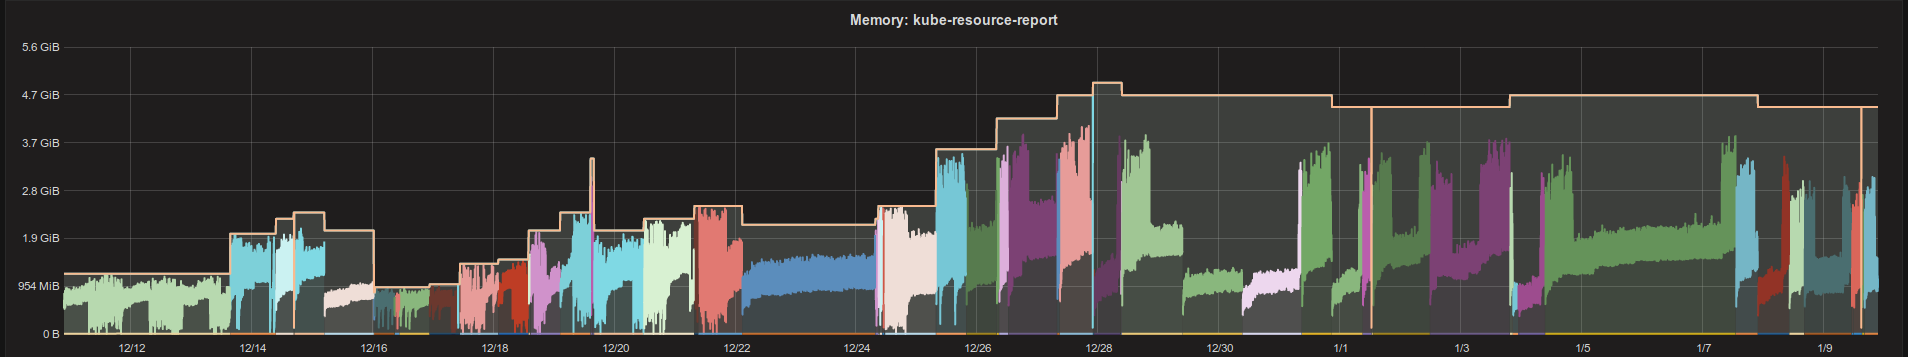
The picture is much clearer here: memory is not a compressible resource, so we need to ensure that our memory request/limit always matches our real demand. The memory usage grows over time, but also drops again at some point in time. The VPA seems to nicely follow the usage curve until ca. 28th of December, afterwards the requests (== limit) stay high, but actual memory usage is much lower for days.
The different colors in above graphs indicate different pods. Kubernetes Resource Report runs with a single pod and VPA will create a new one for changes in resource requests. Kubernetes resource requests/limits are immutable on a pod, changing them leads to recreation of the pod.
Summary
VPA is simple to use (from the perspective of an application developer). Adding a
VerticalPodAutoscalerCRD YAML withupdateMode: Autois all what is needed.VPA adequately increases CPU/memory requests, i.e. no more manual increase of resource requests in YAML files.
We can see some resource slack, even with VPA (does not decrease memory requests even if memory usage is low for 24h).
VPA needs to recreate pods to adapt resources (and I would not have tried VPA with a critical application).
My non-critical and non-horizontal-scalable app works with VPA, I haven't tested anything more complicated.
I haven't digged deeper into the VPA and how it behaves over time, so that's it for now with my first observations.
Do you want to learn more about Zalando's Kubernetes setup? Take a peek at our many public presentations (slides and videos)!
UPDATE 2019-01-10
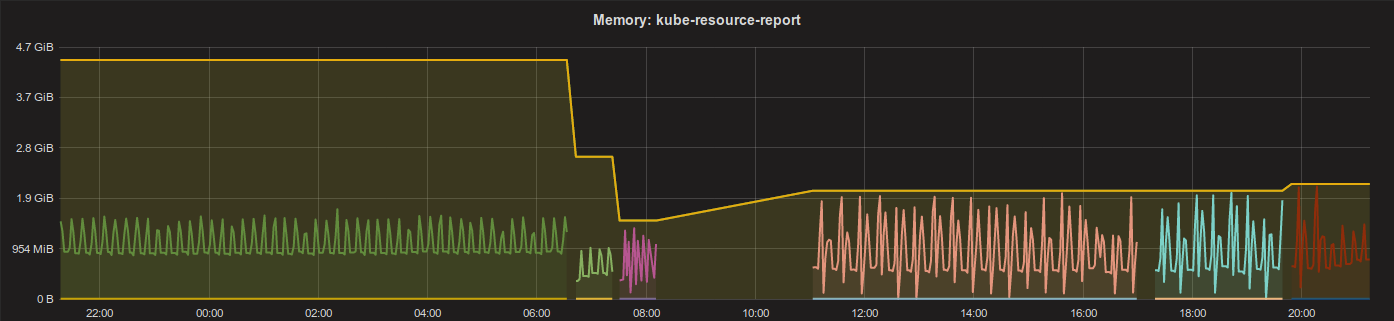
Right the day after writing this blog post, I have sad news! The VPA suddenly decided to lower the memory (good in theory, I complained about memory slack above!) and my pod was stuck in OOMKill restart loop.
Sadly the only way to get out of this situation was to manually update the VPA CRD and set a minimum for memory (minAllowed):
apiVersion: autoscaling.k8s.io/v1beta1
kind: VerticalPodAutoscaler
metadata:
  name: kube-resource-report
  namespace: default
spec:
  resourcePolicy:
    containerPolicies:
    - containerName: kube-resource-report
      minAllowed:
        memory: 2Gi
      mode: Auto
  selector:
    matchLabels:
      application: kube-resource-report
  updatePolicy:
    updateMode: Auto
You can see the problem in the following chart (note the missing usage data for the time the pod was down because of OOMKill):
This is pretty disappointing news and I cannot recommend the Vertical Pod Autoscaler as long as I haven't figured out how to prevent this outage scenario.